Tracking the \"Cognitive Ceiling\": Integrating Bloom's Taxonomy into Real-Time Institutional Dashboards
Excerpt: Every institution has a hidden number it has never measured: the highest cognitive level its teaching actually reaches. Call it the cognitive ceiling — the rung on Bloom's taxonomy where its instruction, its assessments, and its graduates genuinely operate. For most of Indian higher education, that ceiling sits dishearteningly low, and nobody knows it, because nobody can see it. The intelligence layer makes the ceiling visible, live, on a dashboard — and what gets seen finally gets raised.
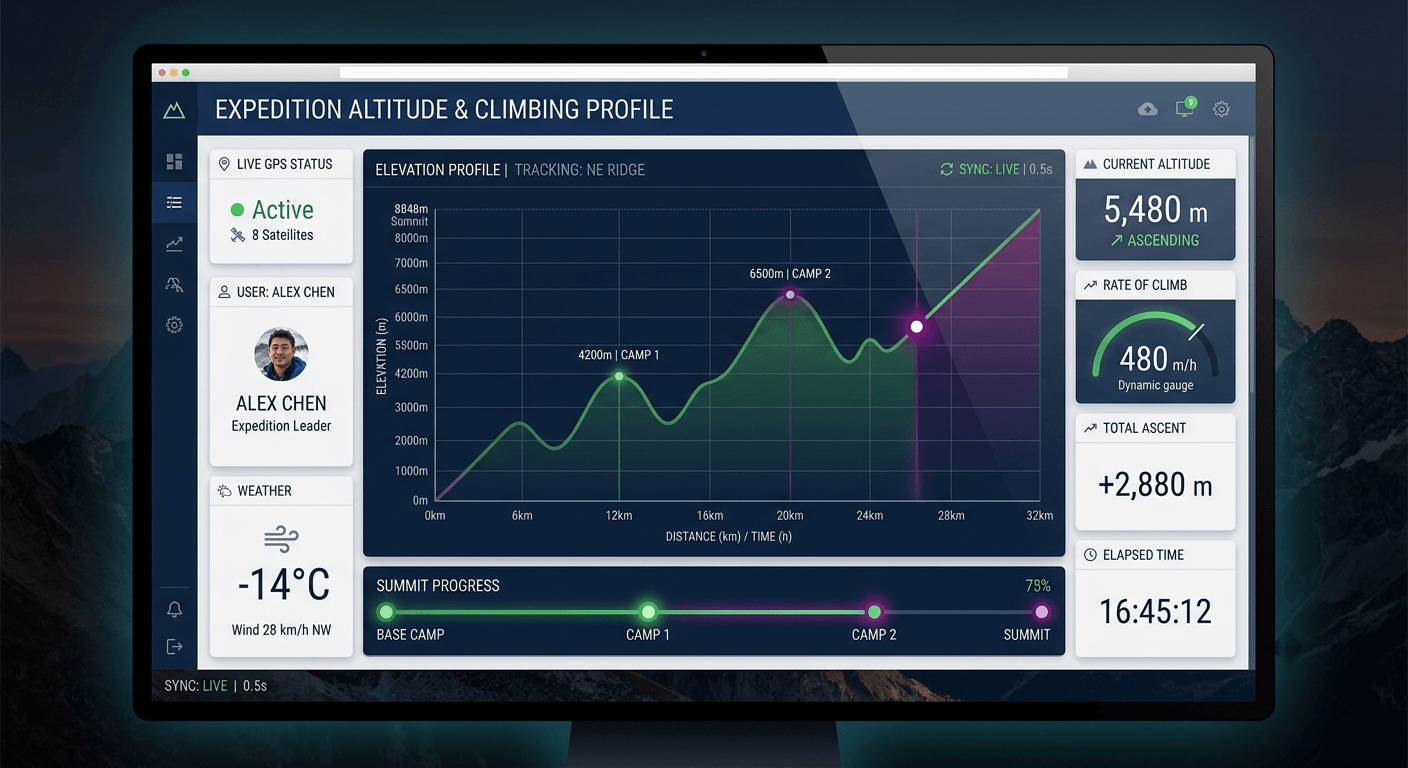
Every college in India has a number it does not know it has:
The highest cognitive level its teaching genuinely reaches. Not the level its syllabus documents claim — those are written in the language of outcome-based education, festooned with verbs like analyse and design because accreditation paperwork rewards the vocabulary. The actual ceiling: the level at which its lectures operate, its assignments demand, its examinations test, and — the number that matters most — the level its graduates can demonstrably perform at when they leave.
For the majority of the system, the honest ceiling is the bottom of Bloom's taxonomy: instruction that transmits content, assignments that reproduce it, examinations that verify recall, and graduates certified as capable of remembering and, generously, understanding. The apply-level essay diagnosed the consequence: a market that transacts two rungs higher, and 29% youth unemployment as the invoice.
But the diagnosis concealed an operational problem that this essay addresses: you cannot fix a ceiling you cannot see. No institution knows its own number. The faculty don't know it — each teaches their course in isolation, unaware of the aggregate altitude. The leadership doesn't know it — their data is marks and pass percentages, which measure nothing about cognition. The regulator doesn't know it — its instruments count credit hours and paperwork, blind to taxonomic depth. The ceiling is invisible at every level of the system that is responsible for it.
The intelligence layer changes this the way it changes everything: by making the invisible a live measurement. This essay describes the cognitive-ceiling dashboard — the institutional instrument that maps every course, every assessment, every learner's demonstrated performance onto Bloom's taxonomy in real time — and the transformation that visibility produces.
How the Ceiling Gets Measured
The measurement rests on the machinery already built across this series:
Every assessment item is classified by its actual cognitive demand. The AI layer reads the institution's instruments — examination questions, assignments, challenge tasks, quiz banks — and classifies each by the Bloom level it genuinely requires, not the level its verb claims. (The gap between claimed and actual is itself a finding: an item starting with "analyse the following" that is answerable by recall from the textbook is a remember-level item wearing a costume. The classifier does not respect costumes.)
Every learner response is scored at its level. The assessment engine — the one that grades work-samples and challenges — does not merely mark right and wrong; it characterises the kind of cognitive act the performance represents. A correct answer achieved by recall, a correct answer achieved by transfer, and a correct answer achieved by creative synthesis are three different data points, even at identical marks.
The aggregate becomes the ceiling — and more usefully,
the distribution. The single number is a blunt summary; the dashboard's real display is the profile: what percentage of this institution's total assessment load, instruction time, and verified learner output operates at each rung. The typical profile, rendered honestly, is a pyramid standing on its head — heavy at remember, vanishing at analyse and above — and seeing that shape on a screen, in one's own institution's colours, has proven to be the most uncomfortable and motivating artifact the leadership has ever confronted.
And it is live. Not an accreditation-cycle snapshot assembled by a committee preparing for a visit — a continuously updating telemetry, refreshed with every assessment administered, every challenge completed, every cohort's progression tracked semester over semester. The ceiling becomes a managed metric, like attendance, like finances, like placements — with the singular advantage that it measures the thing the institution actually exists for.
What the Dashboard Reveals — and Enables
The instruction-assessment gap. The first finding most institutions discover: their teaching and their testing disagree. A faculty member lectures at conceptual depth, then examines at recall — because the exam is what was affordable to grade, or what last year's paper looked like. The dashboard exposes these mismatches course by course: instruction reaches apply, assessment stops at understand — the ceiling is the exam, not the teaching. Often the cheapest ceiling-raising intervention in the entire institution is simply rebalancing assessment to match the instruction that already exists.
The course-level geography of the ceiling. Aggregate profiles disaggregate: which departments genuinely climb, which stall at the bottom rung, which individual items in which question banks drag the distribution down. The ceiling is never institutional — it is a mosaic, and the dashboard turns it from a mystery into a map with named locations. The lift-lever essays' intervention targeting becomes precise: this question bank, this course, this cohort's specific bottleneck.
The learner-level ceiling — the equity finding. The most important disaggregation is by learner: each student's own demonstrated cognitive distribution, feeding their capability graph at its proper taxonomic resolution. Here the dashboard exposes the quiet scandal inside every institution: the ceiling is not the same for everyone. Within the same college, learners in the top cohort get pushed toward application while the struggling cohort is drilled at recall — the assistance layer's old failure mode, now quantified. The equity mandate becomes concrete: not "raise the average" but raise every learner's floor toward the same rung — with the AI tutoring layer providing the one-on-one coaching that makes the same climb possible for everyone, and the dashboard verifying that it happened.
And the market-facing mirror. The institutional profile, paired with the demand fingerprints employers actually post, answers the question placement statistics never could: how far below the market's required cognitive level does this institution's output sit, rung by rung, capability by capability? The distance between the institution's ceiling and the market's floor is — rendered in one graphic — the employability gap itself. Institutions that close the distance see it close visibly, semester by semester; institutions that don't can no longer hide the trajectory behind placement-day percentages.
The Dynamic Nobody Anticipated: The Ceiling Rises Because It's Watched
Instruments change the systems they measure. Once the ceiling is a live, visible, comparable number — shown to leadership, disaggregated to faculty, mirrored to the market, embedded in the accreditation telemetry — the dynamics that kept the system at the bottom rung begin to reverse:
Faculty see their own courses' profiles beside peers' — professional pride becomes a climbing force. Institutional leadership sets ceiling targets the way they set placement targets — resources follow the metric. The accreditation layer, fed real telemetry instead of paperwork, stops rewarding the vocabulary of higher cognition and starts verifying its practice. Employers can see which institutions' graduates genuinely perform at apply-level — and premium hiring flows to the climbers, funding the climb. And learners, watching their own Bloom distributions on their dashboards, gain the most honest progress metric education has ever offered them: not marks that mean nothing, but altitude that means everything.
The system's historic stagnation was never a conspiracy of low standards. It was a measurement vacuum — nobody could see the ceiling, so nobody managed it, and the economics of cheap assessment held the whole edifice at the bottom rung for fifty years. The dashboard is the end of the vacuum.
The Honest Caveats
First, a taxonomy is a model, and the dashboard must not fetishise it. Real cognition does not move in tidy rungs; the classification is an approximation, and gaming will arrive the moment the number gates rewards — items written to look analytical, challenges designed to classify high while teaching low. The instrument-certification and adversarial-audit regimes from the verification essays apply to the classifier itself; the ceiling metric must be validated against external reality (employer outcomes, work-sample performance) or it becomes a more sophisticated fiction than the paperwork it replaced.
Second, the bottom rungs are foundations, not failures. A dashboard that makes remember-level activity look shameful will produce fashionable neglect of foundational drilling that learners genuinely need. The goal is not a ceiling at create for its own sake — it is an honest profile, with each level taught deliberately, assessed legitimately, and surpassed on the way to the rungs the market pays for. Ascension, not abandonment, of the foundations.
Third, visibility has a cruelty threshold. Institutions must be given the machinery to climb before they are measured against the climb — deploying the dashboard as a public shaming instrument without the tutoring layer, the challenge engine, and the fast-cycle curriculum is documenting failure rather than enabling ascent. Sequence matters: machinery first, mirror second.
The Bottom Line
The Indian education system's deepest defect was never the syllabus, the faculty, or even the examination — it was blindness to its own altitude: half a century of certifying at the bottom of Bloom's taxonomy with no instrument anywhere in the system capable of seeing, measuring, or managing that fact.
The cognitive-ceiling dashboard is that instrument: every assessment classified by its true demand, every learner's performance mapped to its cognitive altitude, every course and cohort and institution rendered as a live profile — compared against the market's floor, disaggregated for equity, and updating with every cycle.
What gets seen gets managed. What gets managed gets climbed.
And so the quiet revolution of this essay is the simplest one in the series: put the taxonomy on the dashboard — and watch the entire system, for the first time in its history, look up.


© VidyaShift 2026

Where Learning Becomes Opportunity.
An AI-native learning-to-employment company.